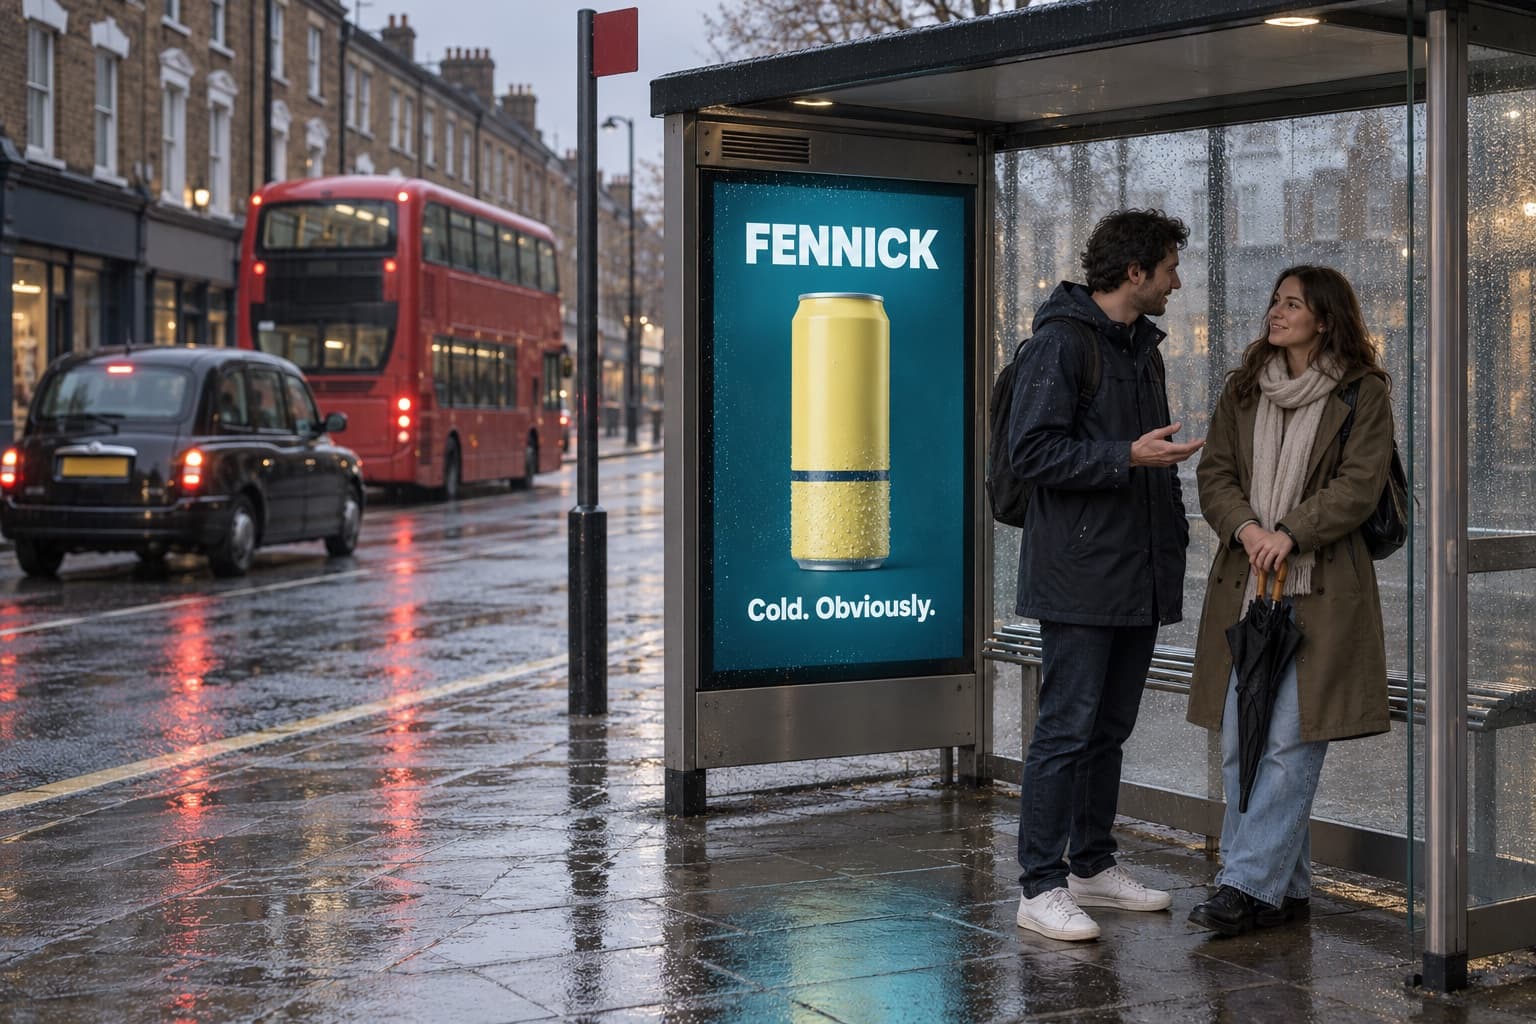

Billboard advertising statistics get thrown around a lot, and most of what circulates online is a rounded percentage lifted from somewhere else with the original source stripped off. The more useful way to read billboard advertising statistics is to start with what is actually being measured, then look at real numbers from an agency that has run campaigns long enough to know which figures hold up. Swing Media has been placing out-of-home campaigns since 1998 — 27 years active across 12 major cities, working with 200+ global brands on a network of 400+ premium sites. Those are first-party numbers we can stand behind, and they are a better anchor for this topic than a recycled stat with no source attached.
The Core Metrics Behind Any Billboard Statistic
Every billboard advertising statistic worth trusting traces back to one of a handful of measurement concepts, not a single magic percentage.
- Impressions count the number of people with a plausible opportunity to see a placement, typically derived from traffic counts and audience-measurement data for that location and format.
- Reach and frequency describe how many unique people see a campaign (reach) versus how many times the average person sees it (frequency) over a flight.
- Gross rating points (GRPs) roll reach and frequency into a single planning number used to compare media weight across formats and markets.
- Dwell time measures how long a passerby is actually near a placement and able to absorb it, which matters more for a bus shelter panel than a highway bulletin seen at speed.
Any billboard statistic you see quoted elsewhere is almost always one of these four concepts dressed up differently. Knowing which one is being cited tells you whether the number is even comparable to the one next to it.
Static vs. Digital: Where the Numbers Diverge
Static and digital billboards are measured the same way in principle, but the numbers behave differently in practice. A static bulletin or poster is sold and measured as a single, exclusive placement for the length of a flight, so its reach and frequency reflect one advertiser's message running continuously. A digital billboard instead rotates several advertisers through the same screen, commonly in 8 to 10 second increments within a 60 to 90 second loop, which means the same location produces a different reach and frequency profile depending on how many advertisers are sharing the rotation. For a full breakdown of how that split affects price rather than just measurement, see our guide to how much a billboard costs.
What 27 Years in the Field Actually Show
The statistic we track most closely internally is not audience size. It is how much a placement's real-world performance depends on things a spec sheet does not capture: the angle of approach, the speed of traffic passing it, and how long a driver or pedestrian's eye line naturally lands on that spot. Two billboards with identical daily traffic counts can perform very differently once you account for whether traffic is moving at 15 miles per hour past a wallscape or 65 miles per hour past a highway bulletin. After placing campaigns across 12 markets for 27 years, our experience is that location-specific dwell time predicts campaign performance better than a raw impressions number does, which is why we build media plans around vantage and approach angle first and treat the impressions estimate as a second check, not the headline figure.
Why Billboards Resist the Usual Ad-Avoidance Numbers
Most digital ad statistics eventually have to account for ad avoidance: a skipped pre-roll, a blocked banner, a closed tab. Billboard advertising does not carry that same erosion, because a placement cannot be skipped, muted, or closed the way a browser tab can. That structural difference is a big part of why out-of-home has stayed a stable line item in media plans even as other channels' effective reach keeps shrinking against avoidance behavior. It also means a billboard advertising statistic about "viewability" is close to meaningless outside digital screens; the more relevant question for a physical placement is whether it sits somewhere the intended audience already has to be.
How to Read Any Billboard Statistic You Find Elsewhere
Before trusting a billboard advertising statistic you find in another article, ask three questions: is it measuring impressions, reach, or GRPs, and does the article say which; is it about static, digital, or blended inventory, since the two behave differently as covered above; and is it a national average or specific to a market, since costs and audience size vary enormously by city. A national average is rarely the right number to plan against for a specific placement, which is also true of billboard cost estimates.
Frequently Asked Questions
What is the most commonly cited billboard advertising statistic? Impressions and cost-per-thousand impressions (CPM) are the two figures advertisers ask about most, because they are the easiest to compare against digital media buys.
How is a billboard impression actually counted? It is derived from traffic counts and audience-measurement data specific to that location and format, not a flat estimate applied to every billboard equally.
Are digital billboards more effective than static ones, statistically? They are not simply "more effective." Digital billboards divide audience attention across a rotation of advertisers, while a static billboard holds one message continuously for the flight, so the two produce different reach and frequency profiles for the same location.
Do billboard advertising statistics vary by market? Significantly. Traffic density, dwell time, and available inventory differ from market to market, which is one reason a national average statistic rarely matches what a specific placement will actually deliver.
Every number above is a starting point for understanding what to ask, not a rate card. To get real, market-specific figures for your campaign, talk to Swing Media directly.